How to Plot the Kaggle Leaderboard Scores for a Particular Competition
I was not making progress on the Jane Street Real-Time Market Data Forecasting Kaggle competition, so I decided to code up a better way to view the leaderboard.
# block 1
import time
import datetime
import os

import pandas as pd
import numpy as np
import matplotlib.pyplot as plt
from typing import Optional

from kaggle.api.kaggle_api_extended import KaggleApi
# block 2
# KAGGLE_KEY and KAGGLE_USERNAME should be set in your ~/.zshrc (if using zshrc in MacOS) environment configuration file
print(f"Using Kaggle username: {os.getenv('KAGGLE_USERNAME')}")
print(f"Using Kaggle key: {os.getenv('KAGGLE_KEY')}\n")

api = KaggleApi()
api.authenticate()
print("Authentication successful")
# block 3
competitions = api.competitions_list()
print(f"Number of currentl active competitions: {len(competitions)}")
# block 4
def fetch_raw_leaderboard(competition_name):
    try:
        leaderboard = api.competition_view_leaderboard(competition_name)
        return leaderboard
    except Exception as e:
        print(f"Error fetching leaderboard: {str(e)}")
        return None

competition_title = "jane-street-real-time-market-data-forecasting"
raw_data = fetch_raw_leaderboard(competition_title)
print(f"Successfully fetched data: {raw_data is not None}")
#block 5
# Initialize leaderboard iterator
submissions = raw_data["submissions"]
iterable = iter(submissions)
position = 0
Once you have initiated the iterable iter(submissions) you can repeatedly run the next block to cycle through the leaderboard submissions and print submission details (e.g. position #, team name, score, submission date):
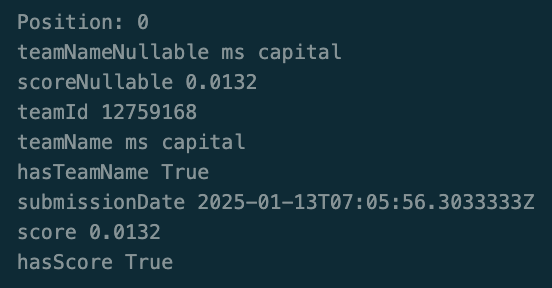
#block 6
# Print each submission
next_submission = next(iterable)
print(f"Position: {position}")
for key, value in next_submission.items():
    print(key, value)
position += 1
This prints the following details, for example:
The next block converts the raw_data (type = dict) into a pandas DataFrame object which can easily be plotted and processed on:
#block 7
df = pd.DataFrame(raw_data["submissions"])
leaderboard = [df["scoreNullable"]]
# Convert scores to numeric values and handle any non-numeric entries
scores = pd.to_numeric(df["scoreNullable"], errors='coerce')
print(f"Length of leaderboard: {len(scores)}")
print(f"Minimum leaderboard score: {scores.iloc[0].item():4}")
print(f"Maximum leaderboard score: {scores.iloc[-1].item():4}")
# Create a figure with a reasonable size
plt.figure(figsize=(12, 6))
# Create a histogram of the scores
max_score = scores[0]
min_score = -0.001
bins = np.linspace(0, max_score, 101)
scores_N = 10000
if scores_N > len(scores):
scores_N = len(scores)
plt.hist(scores[:scores_N], bins=bins, color='skyblue', edgecolor='black', alpha=0.7)
# Add a title and labels
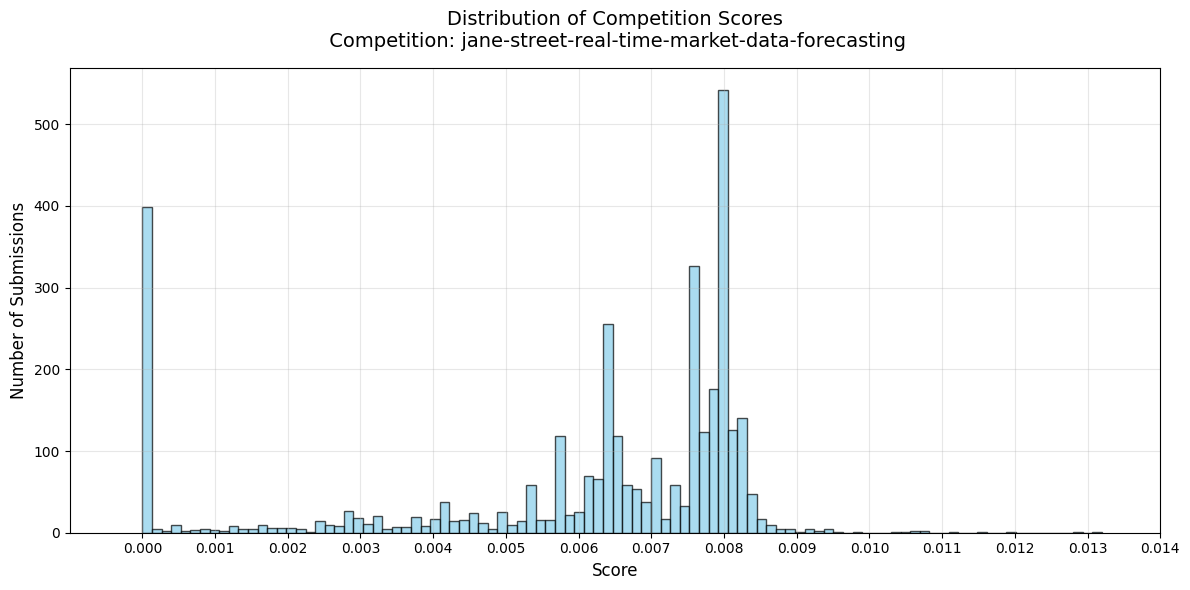
plt.title(f'Distribution of Competition Scores\n Competition: {competition_title}', fontsize=14, pad=15)
plt.xlim((min_score, max_score))
plt.xlabel('Score', fontsize=12)
plt.ylabel('Number of Submissions', fontsize=12)
plt.xticks(np.linspace(0,0.014,15))
plt.grid(True, alpha=0.3)
plt.tight_layout()
plt.show()
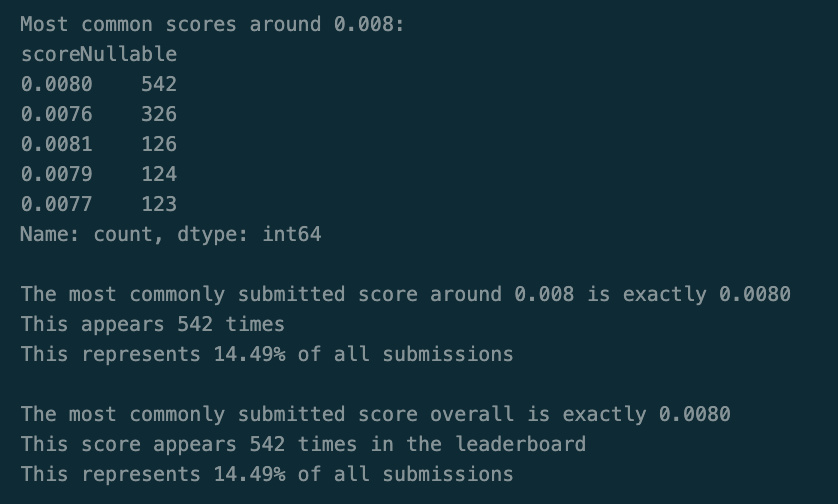
The final block prints leaderboard statistics like the most common score around a particular value (usually this shows the cutoff for the best publically available notebook), and what percentage of all submissions this score represents:
#block 8
value_counts = scores.value_counts()

mask = (scores > 0.007) & (scores < 0.009)
clustered_scores = scores[mask]
clustered_value_counts = clustered_scores.value_counts()
print("\nMost common scores around 0.008:")
print(clustered_value_counts.head(5))

most_common_score_near_0080 = clustered_value_counts.index[0]
most_common_score_near_0080_counts = clustered_value_counts.iloc[0]
percentage = (most_common_score_near_0080_counts / len(scores)) * 100
print(f"\nThe most commonly submitted score around 0.008 is exactly {most_common_score_near_0080:.4f}")
print(f"This appears {most_common_score_near_0080_counts} times")
print(f"This represents {percentage:.2f}% of all submissions")

most_common_score = value_counts.index[0]
frequency = value_counts.iloc[0]
print(f"\nThe most commonly submitted score overall is exactly {most_common_score:.4f}")
print(f"This score appears {frequency} times in the leaderboard")

percentage = (frequency / len(scores)) * 100
print(f"This represents {percentage:.2f}% of all submissions")